On August 13th the Government of Alberta announced that it would keep in place
current levels of COVID-19
restrictions.
Earlier, there had been plans to lift some control measures on August 16th, with
planned changes including removing mask mandates, changes to COVID-19 testing
and contact tracing, and removing mandatory isolation for those testing
positive. The argument had been that the current level of vaccination was
sufficient and Alberta could now make the transition to managing COVID-19 as an
endemic disease. However, current measures will now remain in place. Increases
in ICU numbers above what was expected, and the US experience with COVID-19 in
children, were given as reasons for pausing the move to the next phase until
September 27. Meanwhile, vaccination continues in Alberta, with nearly 10,000
doses being administered per
day.
We have previously published work modeling the impact of pharmaceutical and
non-pharmaceutical interventions on case numbers, health system burden and
population health. Here we use our existing models, adapted to Alberta, to
provide projections of the number of cases and hospital occupancy in Alberta
under two scenarios - current vaccination levels, and an optimistic scenario in
which 90% of eligible Albertans choose to get vaccinated in the near term. A
detailed description of the models can be found here
https://www.medrxiv.org/content/10.1101/2021.02.23.21252309v1
and here
https://arxiv.org/abs/2007.07156.
Background
The COVID-19 vaccine roll out has gone well in Alberta. Figure 1 shows that all
eligible age groups have coverage (with at least one dose) in excess of 60%, and
the age groups with the worst prognosis have around 90% coverage.
Previously, the Government of Alberta has pointed to the high and increasing
levels of vaccination to justify a move away from extraordinary pandemic measures,
in favour of measures similar to those used to manage endemic infectious
diseases such as the flu. However, there are still about 1.5 million Albertans
who are unvaccinated, including around 680,000 children for whom the vaccines
have not been approved yet. Furthermore, though the vaccines are extremely
effective, they are not 100% effective, and a fraction of vaccinated individuals
are not protected from COVID.
A second reason that has been advanced for moving away from the extraordinary
measures is that vaccinations have minimized the likelihood that health care
systems will be
overwhelmed
and that in this context, restrictive measures are no longer justified. Indeed,
in the UK, in past months, the proportion of diagnosed cases that are
hospitalized has declined, and so from a hospitalization point of view, the
health care system is at lower risk from rising cases than before (Figure 2
(left)). However, Alberta has not seen this trend (Figure 2(right)), and neither
has the United States. An
analysis of data
from US states demonstrates that the growth in hospital admissions has followed
the growth in cases in a consistent manner throughout 2021. There is no
indication that the hospitalized proportion of cases has reduced. The difference
between UK and North American data could be attributable to the much higher
testing (including widely-available asymptomatic
testing
with home tests) in the UK compared to Albertan and other Canadian testing
systems. With vaccination increasing the number of asymptomatic cases (even with Delta),
Canada may be missing many individuals with mild or no symptoms. So among the
cases actually being counted in Alberta, the fraction needing hospitalization
has held steady.
Figure 2: Relationship between COVID infection and Hospitalisation: UK and Alberta. Source: http://ourworldindata.org (left); https://www.alberta.ca/stats/covid-19-alberta-statistics.htm#vaccinations (right). Blue dots show the mean number in hospital each week divided by the total number of cases in the week before. For reference, the grey region shows daily case numbers (divided by 100,000), and the black curve shows the rise in vaccination levels in Alberta (one-dose 12+, scaled so that the top represents 100%).
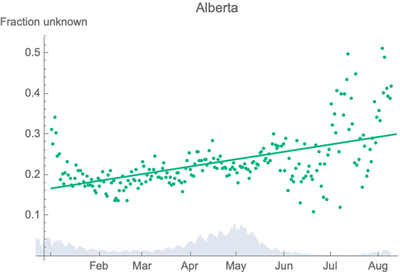
Another source of evidence that many more infections are now being missed in
Alberta is the increasing number of cases for whom we don’t know the infector or
the source of exposure. Figure 3 shows how the proportion of COVID cases of
unknown origin has increased in line with the rollout of vaccination in Alberta.
Infections in vaccinated Albertans are likely to be asymptomatic. However, it is
still possible for them to infect unvaccinated individuals, driving up the cases
of unknown origin. Without widespread asymptomatic testing, transmission from
asymptomatic vaccinated individuals would typically only be identified through
testing asymptomatic contacts of symptomatic (likely unvaccinated) individuals
after they receive a positive test result.
Figure 3: Cases of unknown origin as a proportion of all COVID cases Alberta January to July 2021 (green dots). For reference, the grey region shows daily case numbers (divided by 30,000).
Projected incidence and hospitalization with current measures
The projections we show here assume Alberta continues with the same measures it
has had for the last few weeks. To indicate the seriousness of the current
growth in COVID infections in Alberta, we show projections for cases and
hospitalization under the assumption that no additional measures are ever taken
to reduce transmission, even if hospitalization exceeds acceptable levels.
Furthermore, no hospital capacity limits are included in these projections. As
such, these projections should not be considered to be forecasts, since actions
would be expected to be taken in response to growing hospital demands.
Figure 4 shows COVID incidence by vaccine status for the period January to
September 2021, as projected by the model described at
https://www.medrxiv.org/content/10.1101/2021.02.23.21252309v1.
The black dots plot the observed incidence. The coloured regions show the model
predictions for the same period, demonstrating a good alignment with the
observed data. We then plot the model projections for August, showing that on
September 15th we predict a daily incidence of approximately 4000 cases in
unvaccinated people, and another 2000 in the vaccinated population, most of
which we would never learn about because they do not display symptoms. Figure 8
(top) shows the corresponding projection in the pypm.ca model.
Figure 4: Projected COVID daily case incidence in Alberta, assuming vaccine effectiveness of 94% against severe disease, and keeping current controls in place.
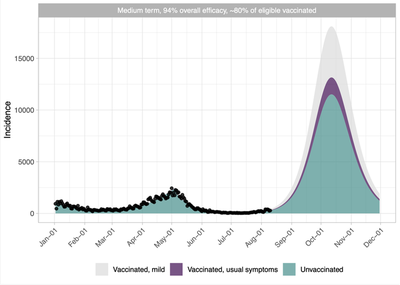
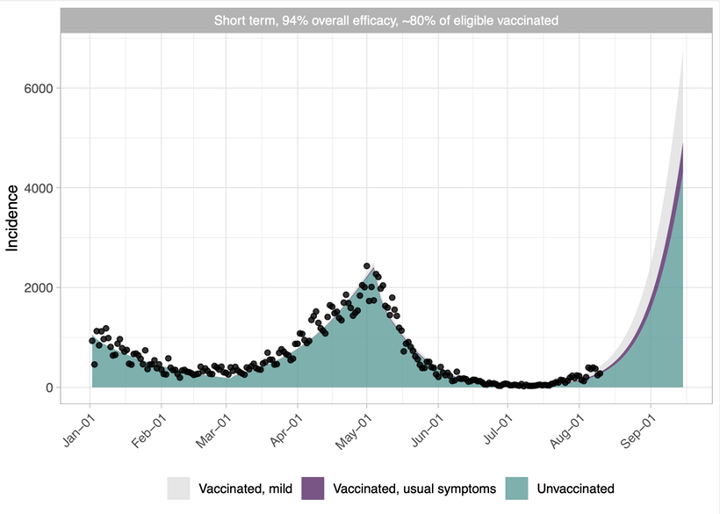
Figures 5 and 8 (bottom) project the incidence out to the end of this year using
two different models, though we note that there is considerable uncertainty in
any such projections. The 4th Wave is predicted to peak at slightly over
17,500 cases per day in the middle of October 2021 (Figure 5) and 12,000 cases
per day (in the model of Figure 8). The impact of these case numbers on the
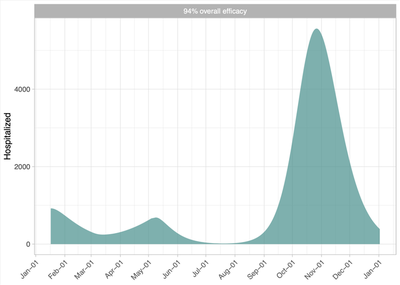
demand for hospital care is shown in Figures 6 and 8, both showing hospital
occupancy well over 4000 at the peak in October, and with Figure 8 showing the
ICU occupancy. This accounts for the fact that vaccination protects against
infection and additionally against symptomatic and severe disease even if
vaccinated individuals do become infected. But since most infections are among
those who are not vaccinated, the demand on the healthcare system per infection
remains high enough to be a concern.
Figure 5: Incidence of COVID in Alberta: Medium-term projection with current controls in place, assuming that 80% of the eligible population is vaccinated and an overall efficacy of 94%, including both protection against infection and severe illness. Most mild cases would likely not be reported, depending on the testing system that is in place.
It is important to remember, as noted above, that these figures are projections
in a scenario with no change in policy or behaviours. The projected peak in
hospital occupancy is several times higher than previous peaks, and those led to
substantial changes in both individual behaviour and public health policy. We do
not expect to observe these projected incidence or hospital volumes, because we
think policy would change to protect hospital capacity, and individuals will
change their behaviour in response to such high case numbers. What is clear from
these analyses is that there are substantial evidence-based reasons to believe
that greater utilization of non-pharmaceutical interventions – such as social
distancing, masking and air filtration will be required to protect the Alberta
health care system, and the health of Albertans, while vaccination coverage is
expanded.
Figure 6: Total number of COVID-19 patients in hospital, primarily composed of unvaccinated Albertans.
What about kids?
There is considerable fear and
concern
about the return to school in September, especially given the numbers of
children in hospitals in the US. Will COVID-19 in schools this year be like last
year? In the fourth wave in our projections, community transmission will be
considerably higher than it was in the 2020/2021 school year. School exposures
have reflected community transmission, and while most exposures have not led to
outbreaks or transmission clusters, COVID-19 can be transmitted in schools. With
a surging fourth wave, exposures in schools will likely be higher than they were
in the past. Furthermore, schools may not continue with COVID measures.
Children under 12 are unvaccinated (but vaccines may be approved in the fall),
and so they make up a larger portion of the unvaccinated population than they do
of the total population. Vaccination rates are also lower in the 12-20 group
than in the higher ages. Together with exposures and reduced control measures in
schools, this means that transmission within schools could increase sharply. In
addition, Canadian schools have not been open at a time when the Delta variant
was circulating, so we need to look to the situation in the US and the UK to
learn more about Delta in schools. Finally, without online learning in place,
children who are at additional risk will be in school. While just under 0.5%
(1/200) children with COVID-19 have needed hospital care, a substantial fourth
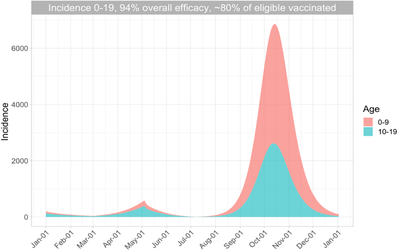
wave in children could leave many in need of hospitalization. Figure 7 shows the
age-structured models' projection for daily incidence in those aged 0-9 and
10-19, assuming that the same fraction of those infections is detected as in the
general population.
Figure 7: Projected daily incidence in those aged 0-9 and 10-19. Assumptions are as in Figure 5, but here only the selected age groups are shown.
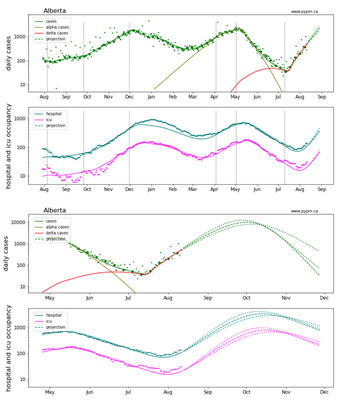
Multiple models give the same qualitative projections
These models synthesize data on vaccination levels, vaccine efficacy,
transmission rates, hospitalization, among other factors, in order to understand
COVID-19 transmission and its likely impact. Different models make different
assumptions along the way. Here we compare two very different models - the one
above and the one at www.pypm.ca by Dean Karlen at
the University of Victoria (see
https://pypm.github.io/home/docs/studies/prov20210810/).
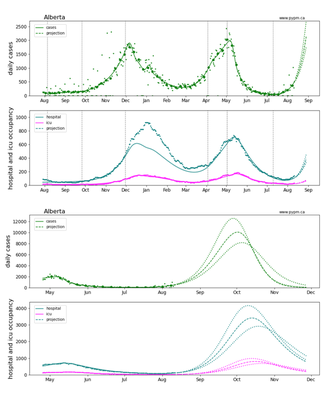
Figure 8 (top panels) shows a short-term projection of infections along with
hospital and ICU occupancy, with a longer-term scenario in Figure 8 (bottom
panels). The model tracks data very closely for Alberta and other jurisdictions.
Figure 8: Model fit and short-term projections of reported cases (top) and hospital and ICU occupancy in Alberta (second panel) in the short term. The larger dots are case rates averaged over each week. Longer range projections (bottom panels). See www.pypm.ca. For a log-scale version see the Appendix.
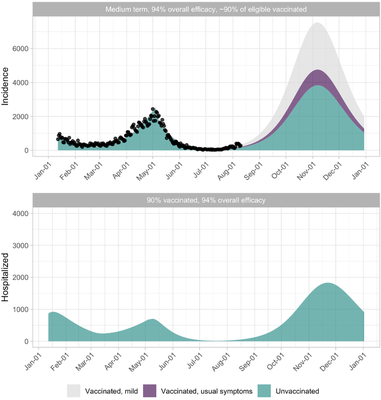
Increasing Vaccination
The importance of vaccination as the way to maintain control of the pandemic and
transition to the endemic status which the government is targeting is
demonstrated in Figure 9. Here we model an expanded vaccination program over the
coming weeks that is able to vaccinate 90% of the eligible population. We can
see that a 90% vaccination rate reduces the peak number of people in hospital
from over 5500 to below 2000. Such an accelerated vaccine rollout in the near
future is probably not realistic, but our results motivate keeping in place or
expanding current control measures until a 90% vaccination rate is achieved.
Vaccines, with appropriate non-pharmaceutical interventions, will enable the
safe transition out of the extraordinary pandemic restrictions that Alberta has
lived with over the past 17 months. The vaccination roll out programme has
achieved an impressive reduction in the number of Albertans at risk of severe
disease should they become infected. It has also prevented many Albertans from
being infected with COVID-19 in the first place. However, the analyses
summarised above indicate that current level of vaccine coverage in Alberta is
not sufficient to allow the complete re-opening of the province without
significant damage to the Alberta health care system and by extension to the
long-term health of Albertans.
Figure 9: Incidence and number hospitalized due to COVID in Alberta: under a vaccination rollout where 90% of the eligible population is vaccinated over the coming weeks.
Acknowledgements
We thank the BC COVID-19 Modelling Group
and Christopher MacCabe (Institute of Health Economics) for helpful discussions.
We thank PIMS for supporting our work.
Appendix
Figure A1: Log-scale plots of the short (top panels) and long (bottom panels) term projections from the pypm.ca model, showing the close fit of the model to past data and the rise of the Alpha and then Delta variants.
](/post/alberta-4th-wave/figure1_hubf3148cd20f7591df07f14d6e444c5c3_51336_b33834199ab9b3111370218ad7da13be.png)
 (right). Blue dots show the mean number in hospital each week divided by the total number of cases in the week before. For reference, the grey region shows daily case numbers (divided by 100,000), and the black curve shows the rise in vaccination levels in Alberta (one-dose 12+, scaled so that the top represents 100%).](/post/alberta-4th-wave/figure2_hu476eaebcf0a938ae39bb2bc38d242077_84287_ab30fe4ead32e206a98f454889adeb0d.png)