Are there COVID variants amongst us?
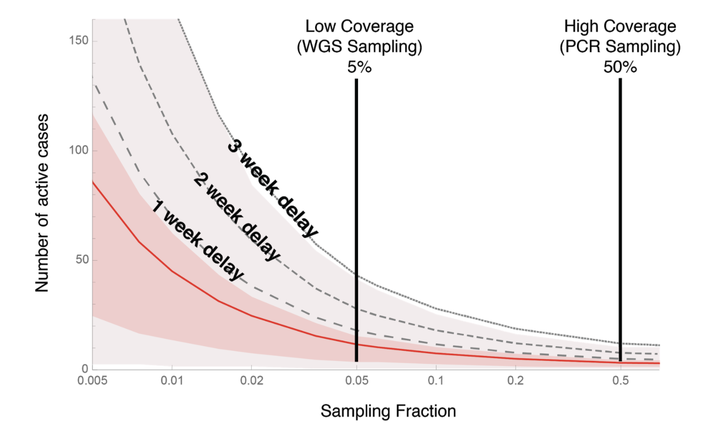 Number of active cases of a VOC when first detected (y-axis) depends on how
much we’re looking (x-axis is the fraction of cases assessed for the
variant)
Number of active cases of a VOC when first detected (y-axis) depends on how
much we’re looking (x-axis is the fraction of cases assessed for the
variant)
Background
The appearance of new COVID-19 Variants of Concern has jurisdictions around the world scrambling to determine whether variants are already circulating within their communities. Here we present modelling results that indicate how many active cases are likely circulating within a community before the first variant is detected and how this number depends on the sampling strategies used by Public Health authorities.
A new Variant of Concern (VOC) was described in the December 21st Public Health of England report 1, sounding the alarm that a more transmissible form of the SARS-CoV-2 virus that causes COVID-19 had emerged (“B.1.1.7”). Because B.1.1.7 altered one of the three probes used in the COVID-19 test in the UK (“TaqPath”), officials could determine whether or not each individual tested carried this new VOC, leading to hundreds of thousands of data points. Week after week and health region after region, B.1.1.7 was found to rise in frequency across the UK. Detailed analyses of these data estimated that B.1.1.7 increases the reproductive number ($R_t$) of COVID-19 – the number of new cases per infected individual – by ~50% (2: 40-80% depending on the estimation method used, see also 3).
Many other jurisdictions use different tests to detect COVID-19, which do not distinguish among the VOCs. In such cases, whole genome sequencing (WGS) is being used to determine which variant (VOC or not) is carried by an infected individual. WGS has the benefit of detecting any variant – including undiscovered variants – but processing and analysing the genomic data can add delays of weeks to months and is often conducted on only a fraction of cases. In Canada, for example, approximately 5% of COVID-19 samples are sent for WGS.
Alternatively, targeted PCR tests can search specifically for VOCs (and their close relative variants) by scanning virus samples specifically for the changes that are common to the new variants (e.g., the N501Y mutation in the spike gene or the deletion in ORF1a,b). While it is possible to ramp up WGS, PCR testing can be scaled up more easily to handle thousands of samples, making it possible for jurisdictions to screen all current cases for specific VOCs at once.
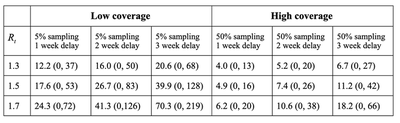
Here we use a stochastic model to ask how the sampling fraction (currently low by WGS or high by either PCR or much enhanced WGS) affects the number of active VOC cases that are likely to be circulating within a community when the variant is first detected. We simulate the new infections caused by each infected individual in each viral generation (taken to be about a week 2), assuming that a fraction of these cases are randomly sampled for further testing (see discussion below about non-random sampling). We further assume that the VOC is spreading in the community with a reproductive number of $R_t = 1.5$, but results are similar for other $R_t$ values (Table 1).
How many cases are escaping notice?
When we detect the first individual in the community with a VOC, how many others are there likely to be already? Figure 1 shows the number of active cases circulating within a community when a VOC is first detected (y-axis) as a function of the sampling fraction (x-axis). The mean is shown as a red curve, assuming no delays between when an individual is first infected and when results from the sequencing are available. The shaded regions illustrate the variability around the mean. The black curves add delays of one to three weeks before results are relayed back to public health teams. These delays buy time for the VOC to build up to even higher numbers before first reported, but they are realistic, because whole genome sequencing often requires sending samples to a central lab for sequencing, and requires processing time. Clearly, the higher proportion of samples that are tested, the lower the number of active cases at the time of detection.
This figure immediately illustrates the risks of a low-coverage WGS strategy (first vertical line set at current levels of sampling in Canada). On average, by the time we first detect a VOC case there will be a couple of dozen active cases in the community and potentially over 80 (average = 26.7 with 95% CI from 0 to 83, assuming a processing delay of two weeks).
By contrast, looking for VOCs with PCR tests (or with a greatly ramped up WGS strategy, as in Denmark, which now sends 100% of positive cases for WGS) is much more likely to detect them while they are still at low numbers within the community. For example, the second vertical line illustrates the case where half of all individuals infected with SARS-CoV-2 are tested for VOCs, by PCR or a greatly ramped up WGS strategy. Because of this higher coverage, we are likely to detect a variant while it is still in low numbers, slashing the expected number of active cases by over 70% compared with current 5% WGS sampling (average = 7.4 with 95% CI from 0 to 27, assuming a processing delay of two weeks). In addition, rapid testing by PCR likely would reduce delays , lowering further the risk that the VOC has spread to high numbers (Table 1).
Hybrid testing by PCR and WGS
Jurisdictions may seek to alternate sampling approaches between weeks of low coverage (5% WGS) and weeks of high coverage (50% PCR). Alternating PCR and WGS by week, for example, balances the ability to detect when and where a new variant is circulating within the community with the benefits of whole genome sequencing (including detecting new mutations, tracking where the virus has come from, and contributing to the global database of information on COVID-19).
Figure 2 explores how alternating the sampling strategy between weeks between high (PCR) and low (WGS) coverage would affect the number of circulating active cases at the time that a variant is detected, assuming two week delays for reporting:
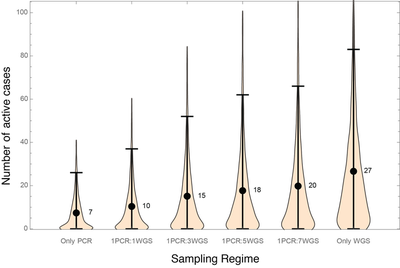
In terms of detecting known variants, PCR every week (first set of simulations on the left) or every other week (second set) both work well, keeping the expected number of active cases at or under ten at first detection. Replacing PCR with WGS at a constant low percentage of cases risks too much spread of known variants detectable by PCR while attempting to find and isolate new emerging variants by WGS. Therefore, if WGS cannot be ramped up sufficiently, PCR detection of VOCs needs to be conducted alongside WGS.
Who to sample to detect VOCs?
Random sampling is the only way for us to know if VOCs are in a community. If resources are limited, then testing one member of a household or known cluster would be nearly as effective at discovering VOCs.
Using a portion of Public Health resources to sample travellers and their contacts is a valuable way to catch VOCs before they circulate more broadly in the community, effectively casting the net of detection around likely sources of VOCs into a region. But once the VOCs do become established, targeting testing to travellers becomes largely ineffective because travellers represent a small portion of new cases, as observed with the initial COVID-19 strains 4.
The relative value of sequencing randomly versus sequencing known travellers depends on how well travellers and their households self-isolate. If there were no risk of onward transmission from known travellers and if VOCs were brought into the community from other sources (e.g., due to unrestricted or unknown travellers from other regions), then all sequencing resources should be focused on randomly sampled cases, because the known travellers are not the risk.
What are the risks? Until recently, travellers to Canada were required to self-isolate, but their household members were not. This provided an Achilles’ heel for VOCs to get into the country: by passing from self-isolating travellers to their household members and then out into the community. In such cases, sequencing COVID-19 from known travellers helps ramp up contact tracing and quarantine measures around anybody carrying a new VOC into the country.
Unrestricted travel within countries or across land borders is also a major risk, because such travel is often unknown and unmonitored. Adding PCR test requirements for such travellers, as well as self-isolation periods is needed to reduce the risk of VOCs arriving from other areas where they have established.
Policy and practical considerations
Recent travel restrictions in Canada now require travellers arriving on international flights to have a negative PCR test before boarding, have another test on arrival and then stay in a hotel until they receive negative test results. This is a step in the right direction to protect Canada from variants entering from other countries, though as of the current time these measures do not apply to travellers from the US. But unless every province is able to detect and eliminate circulating cases of these new more transmissible variants, travel from other provinces remains a vulnerability.
Each and every one of us can also help reduce the risk of variants establishing within an area. Wearing high-quality masks indoors and out, reducing interactions beyond households, and self-isolating after close contact with cases, whether or not we feel symptoms, all will help. But to really prevent the establishment of new variants into new regions requires severely limiting travel and isolating travellers and their households, including travellers within countries and across land borders. We would have to combine this with quick and proactive public health actions when variants are detected. This could include the immediate use of rapid tests to ensure that clusters of variants are stopped before spreading further, implementing geographically specific restrictive measures, and prioritizing contact tracing (though contact tracing is limited 5). And every day that we take these actions – every day that we delay these new variants from establishing within a region – is a day more of vaccinations protecting our communities.
MODEL DETAILS:
We conducted a stochastic model of transmission from an index case carrying a new variant, approximating the serial interval as one week and treating the period of time during which individuals are infectious as ~1 week 6. These approximations allow us to treat the number of active cases each week as a discrete-time random walk. Specifically, starting with a single case introduced into a jurisdiction, the number of onward cases each week is randomly drawn from a negative binomial distribution, with a mean per case of $R_t = 1.5$ and an overdispersion index per case of 0.7, as estimated for COVID-19 6. $R_t = 1.5$ represents a 50% increase in transmission compared to current COVID-19 in regions where $R_t$ is about 1 (as in several provinces in Canada).
Each case is sampled for genetic testing with a probability given by the sampling fraction, f. If not detected in the current week, the process is repeated in subsequent weeks, until the variant is detected. In cases where the initial cluster does not become established (no active cases remain), the process is restarted from the next variant introduced into the community. This process is repeated 5000 times for different sampling fractions. The number of active cases in the week that a variant is detected is reported above.
Figure 1 illustrates the mean (red curve) as well as the following quantiles: 97.5%, 75%, 25%, and 2.5% (shading from top to bottom). Figure 2 explores alternating sampling strategies, with varying schedules of high (50%) and low (5%) sampling effort, assuming that the variant first arises at a random time within this alternating schedule. CI (“credibility intervals”) are highest density intervals, which can include zero because a variant can be sampled but then not lead to any active cases at the time of reporting because of delays in genotyping.
References:
-
Public Health England. 2020. Investigation of novel SARS-COV-2 variant: Variant of Concern 202012/01. Version 1, release date 21/12/2020. https://www.gov.uk/government/publications/investigation-of-novel-sars-cov-2-variant-variant-of-concern-20201201 ↩︎
-
Volz, E., et al. 2020. Transmission of SARS-CoV-2 Lineage B. 1.1. 7 in England: Insights from linking epidemiological and genetic data. virological.org. https://virological.org/t/transmission-of-sars-cov-2-lineage-b-1-1-7-in-england-insights-from-linking-epidemiological-and-genetic-data/576 ↩︎
-
Davies, N.G., et al. 2020. Estimated transmissibility and severity of novel SARS-CoV-2 Variant of Concern 202012/01 in England. medRxiv. https://doi.org/10.1101/2020.12.24.20248822 ↩︎
-
Russell, T.W., et al. 2021. Effect of internationally imported cases on internal spread of COVID-19: a mathematical modelling study. The Lancet Public Health 6: e12-e20. ↩︎
-
Tupper, P., Otto. S., Colijn, C. Fundamental Limitations of Contact Tracing for COVID-19. medRxiv. https://doi.org/10.1101/2020.12.15.20248299 ↩︎
-
He et al. BMC Public Health (2020) 20:1558 ↩︎