The Tipping Point of Contact Tracing
Contact tracing, combined with social distancing measures, can be an effective strategy to keep COVID-19 numbers down (Kucharski et al. 2020) and has been the main strategy used in many parts of Canada. Starting with a team of about a dozen contract tracers, British Columbia, for example, has been ramping up towards a thousand tracers, who collectively have helped to bend down the numbers of COVID-19 cases in the province.
By calling individuals who might have been exposed and encouraging them to self-isolate before infecting others, contact tracers reduce the reproductive number of a disease, $R_0$ (the number of new cases per infected individual while most people remain susceptible). Contact tracers also act as a swat team, deploying extra effort in places where cases are ballooning (e.g., in Kelowna BC in July and in BC’s Fraser health region in October).
But contact tracing has its limits. When the numbers are small, contact tracers can reach a large fraction of the individuals who have been in close, direct contact with known cases. With an increasing number of cases, however, the capacity to call exposed individuals eventually reaches a cap. As a result, contact tracing introduces “bistability” into the dynamics of an epidemic: tamping down infections when the numbers are low but not when they are high.
Mathematically, we can describe the effects of contact tracing using a function $f(I)$ to describe the fraction of infected cases, $I$, at time $t$ that can be reached by contact tracers, leading to self-isolation. In the simplest epidemic model (SIR), this changes the dynamics for the number of actively infected cases to:
$$ I(t+1) = I(t) + \beta S(t) I(t) - f(t) I(t) - \kappa I(t) $$
where $\beta$ is the transmission rate, $\kappa$ the clearance rate without contact tracing (through recovery, death, or isolating when sick), and $S(t)$ is the number of susceptible individuals. Here, I use a discrete-time model with time measured in days to allow comparisons with daily contact tracing capacity.
While the disease remains rare, we can treat the number of susceptible individuals as roughly constant, in which case contact tracing can prevent the number of cases from growing if the reproductive number with contact tracing, $R_0^c$ obeys:
$$ R_0^c=\frac{\beta S}{(\kappa + \mbox{max} )} <1 $$
where $\mbox{max}$ is the maximum fraction of all exposed individuals who are reached by contact tracing and who subsequently self-isolate when case numbers are low. If other measures are not enough to control the disease without contact tracing ($ R_0=\frac{\beta S}{\kappa} >1$), then contact tracing must be able to increase the total clearance rate from $\kappa$ to at least $ R_0 \kappa$ to control the disease while rare (i.e., $\mbox{max} > (R_0 - 1 ) \kappa$).
There is a threshold number of cases $I*$, however, above which contact tracing will fail, determined by the number of infections causing the reproductive number to equal one:
$$ \frac{\beta S}{\kappa +f(I^*)}=1 $$
In other words, if the cases rise to the point that the contact tracing capacity equals $f(I^*)= (R_0 -1) \kappa$, then each infection will lead to one other infection. Above this threshold, the cases will soar again and not be brought down by contact tracing (see Figure).
Given the highly stochastic nature of this disease (Endo et al. 2020), COVID numbers fluctuate over time and may exceed the threshold by chance, particularly if uncontrolled spread occurs in sub-populations or the public temporarily reduces their social distancing behaviour (e.g., around holidays).
One general message that we can already see in this simple model is that the more effective other measures are at reducing $R_0$ (social distancing, self-monitoring, mask wearing, reduced numbers of interactions, etc.), the longer contact tracing will work. For example, in places where $R_0$ is 1.5 without contact tracing, contact tracing will continue to work as long as it is able to increase the total clearance rate by 50% (from $\kappa$ to $1.5 \kappa$). If few control measures are in place and $R_0$ is 3, however, then contact tracing will hit the threshold even if we have so many tracers in place that they triple the total clearance rate at that point (from $\kappa$ to $3 \kappa$).
Another implication is that once the threshold is breached, the growth rate of the disease will start to climb, with $R_0^c$ rising from 1 at the threshold back to $R_0$ as if there were no contact tracing. Consequently, active case numbers quickly reach a point where contact tracing has a negligible impact on the daily growth rate of the disease (panel C), because tracing clears a smaller and smaller fraction of the rising case load.
Toronto recently exceeded this tracing threshold. With cases soaring, Toronto Public Health called off contact tracing, instructing health officers to focus instead on outbreaks.
Public health authorities in regions relying on contact tracing must thus pay close attention to signs that they may be nearing the tipping point of this tracing threshold. Paying attention to the fraction of cases who are self-isolating as a result of contact tracing may help, ramping up restrictions as that fraction falls (panel B).
The rest of us are collectively responsible for continuing the other social distancing measures that ensure $R_0$ remains low, together reducing the risk of a breach of the flood gates against COVID.
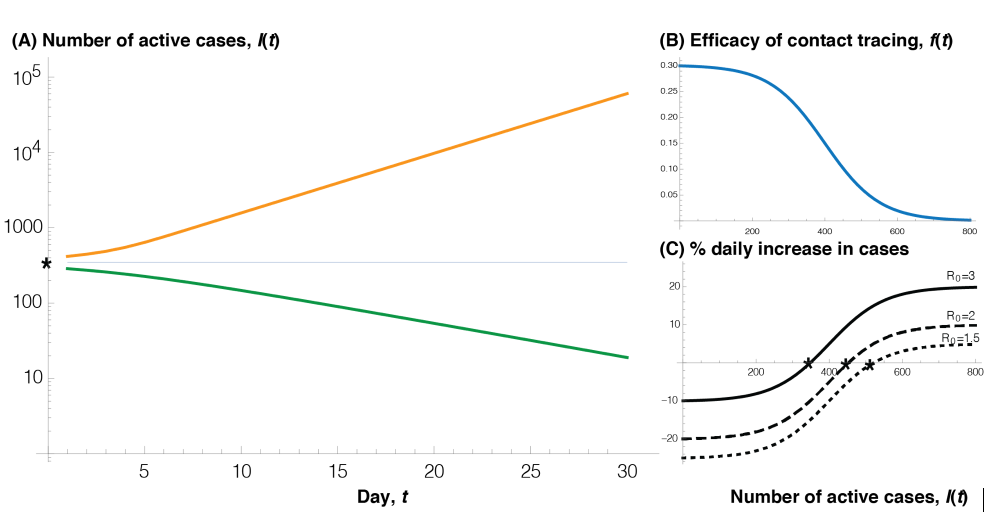
Figure 1. illustrates the collapse of contact tracing once the threshold number of cases (*) is reached. (A) Below the threshold, case numbers are controlled (green curve), but once above the threshold, active case numbers grow exponentially (orange curve, note log scale). (B) Here, I assume that the ability of contact tracing to identify and isolate cases declines logistically from max towards zero as cases rise in number:
$$ f(I)=\frac{\mbox{max}}{(1-\alpha)+ \alpha^{(1-I/{K_m} )} (1-α)^{(I/{K_m} )} } $$
$K_m$ is the case number $I$ at which contact tracing is half as effective as when few people are infected, while α determines the rate of decline in efficacy. (C) Other measures that reduce the spread of the disease and lower $R_0$ raise the threshold, allowing contact tracing to work longer. Parameters: $K_m = 400, \alpha = 0.005, \mbox{max} = 0.3, \kappa = 0.1, R_0 = \frac{β S}{\kappa} = 3$, unless noted otherwise. Alternative parameters can be explored on this app: https://shiney.zoology.ubc.ca/otto/ContactTracingLimits/ or in the frame below.